
px.imshow draws square cells by default for NumPy arrays and pandas DataFrames (aspect="equal"). With aspect="auto", the cells stretch to fill the whole plotting area instead. Use "auto" when a wide or tall matrix would otherwise render as a thin strip, or when you need box-zoom to select a thin slice of the heatmap.
What aspect does in px.imshow
aspect="equal"keeps every cell square: one cell is as wide as it is tall. The heatmap keeps the shape of your array, so a 6 × 48 matrix becomes a long, thin strip.aspect="auto"keeps the plotting area fixed and stretches the cells to fit it, so they are usually no longer square.aspect=None, the default, means"equal"for NumPy arrays, lists and DataFrames, and"auto"for xarray data, whose coordinates often have different units.
Before and after: a wide matrix
Here is a 6 × 48 matrix of random values, drawn twice:
import numpy as np
import plotly.express as px

rng = np.random.default_rng(7)
data = rng.normal(size=(6, 48))   # 6 rows, 48 columns

# Default: aspect="equal", square cells
fig = px.imshow(data, color_continuous_scale="RdBu_r")
fig.show()

# Stretch the cells to fill the plot
fig = px.imshow(data, aspect="auto", color_continuous_scale="RdBu_r")
fig.show()
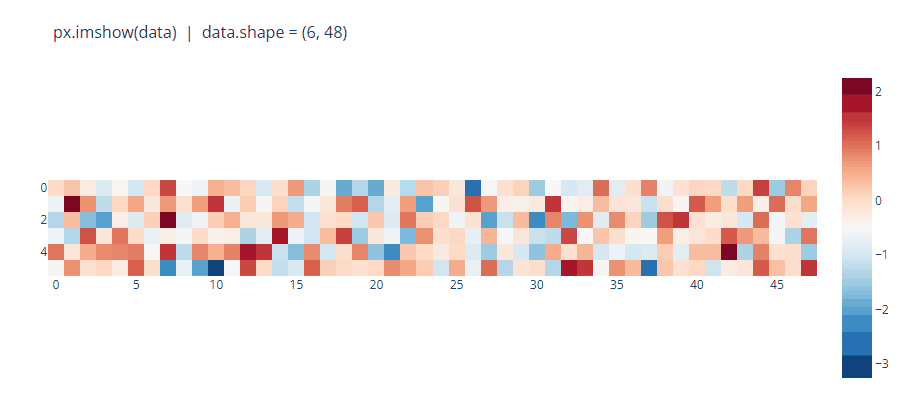
px.imshow(data): square cells turn a 6 × 48 matrix into a thin strip.With the default, the 48 columns fill the width, but because every cell must stay square, the six rows end up only about 100 pixels tall and most of the figure is empty.
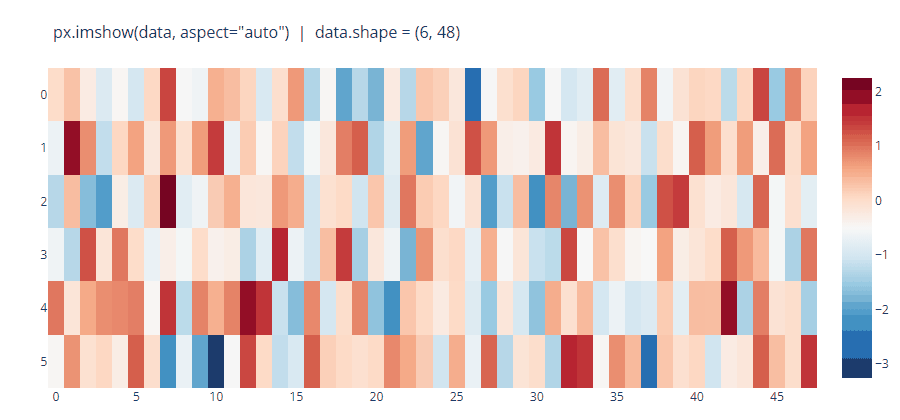
aspect="auto" the same data fills the plotting area.With aspect="auto", the same data fills the whole plotting area. Each cell is now taller than it is wide, which is fine for a heatmap: the colour carries the information, not the cell shape.
Why box-zoom is locked with aspect=”equal”
If you drag a box to zoom into a default px.imshow heatmap, the zoom box keeps its proportions, so you cannot zoom into a thin horizontal or vertical slice. That is the behaviour reported in plotly.py issue #3636.
The reason is in the layout that aspect="equal" sets. You can inspect it:
fig = px.imshow(data)
print(fig.layout.xaxis.scaleanchor, fig.layout.xaxis.constrain)   # y domain

fig = px.imshow(data, aspect="auto")
print(fig.layout.xaxis.scaleanchor, fig.layout.xaxis.constrain)   # None None
With scaleanchor="y", the x-axis is tied to the y-axis, so zooming one zooms the other by the same amount. aspect="auto" removes that link, and box-zoom then works in any direction.
RGB images ignore aspect
For a colour image, an array with shape (height, width, 3) or 4 channels, px.imshow draws an Image trace instead of a Heatmap. The aspect argument has no effect there, and the browser keeps the pixels square (issue #5172). To let the image zoom freely, remove the axis link, as a Plotly collaborator suggests in issue #4861:
fig = px.imshow(rgb_image)
fig.update_layout(xaxis_scaleanchor=False, yaxis_scaleanchor=False)   # False, not None
Other px.imshow options worth knowing
Most real heatmaps, such as a correlation matrix, use a few more arguments:
import pandas as pd

df = pd.DataFrame(rng.normal(size=(200, 5)),
                  columns=["price", "rooms", "area", "age", "distance"])
corr = df.corr()

fig = px.imshow(
    corr,
    text_auto=".2f",                   # print each value in its cell
    aspect="auto",
    color_continuous_scale="RdBu_r",   # blue for negative, red for positive
    zmin=-1, zmax=1,                   # fix the colour range for correlations
    labels=dict(x="Feature", y="Feature", color="Correlation"),
)
fig.show()text_auto:True, or a d3 format string such as".2f", writes the values in the cells (single-channel data only).color_continuous_scale: any named Plotly colour scale, such as"Viridis"or"RdBu_r", or a list of colours.zminandzmax: fix the ends of the colour scale. Without them the range follows your data.labels: titles for the x axis, the y axis and the colour bar (keysx,yandcolor), also used in the hover text.xandy: tick labels for the columns and rows. Their lengths must match the array.origin:"upper"(the default, row 0 at the top) or"lower".
FAQ
What is the default aspect in px.imshow?
None, which means "equal" (square cells) for NumPy arrays, lists and pandas DataFrames, and "auto" for xarray data.
How do I make a px.imshow heatmap fill the figure?
Pass aspect="auto". The cells then stretch to fill the plotting area. To change the size of the figure itself, use fig.update_layout(width=..., height=...).
Why can’t I zoom into part of my px.imshow heatmap?
With the default aspect="equal", the x-axis is anchored to the y-axis, so the zoom box keeps its shape. Use aspect="auto" to zoom freely.
Does aspect=”auto” work for RGB images?
No. For colour images, px.imshow uses an Image trace, which keeps pixels square. Remove the axis link with fig.update_layout(xaxis_scaleanchor=False, yaxis_scaleanchor=False) instead.
The code in this post was tested with plotly 5.22, and the aspect behaviour matches the current plotly 7 documentation. For more chart types in Matplotlib, Seaborn and Plotly, see the Python data visualization guide.