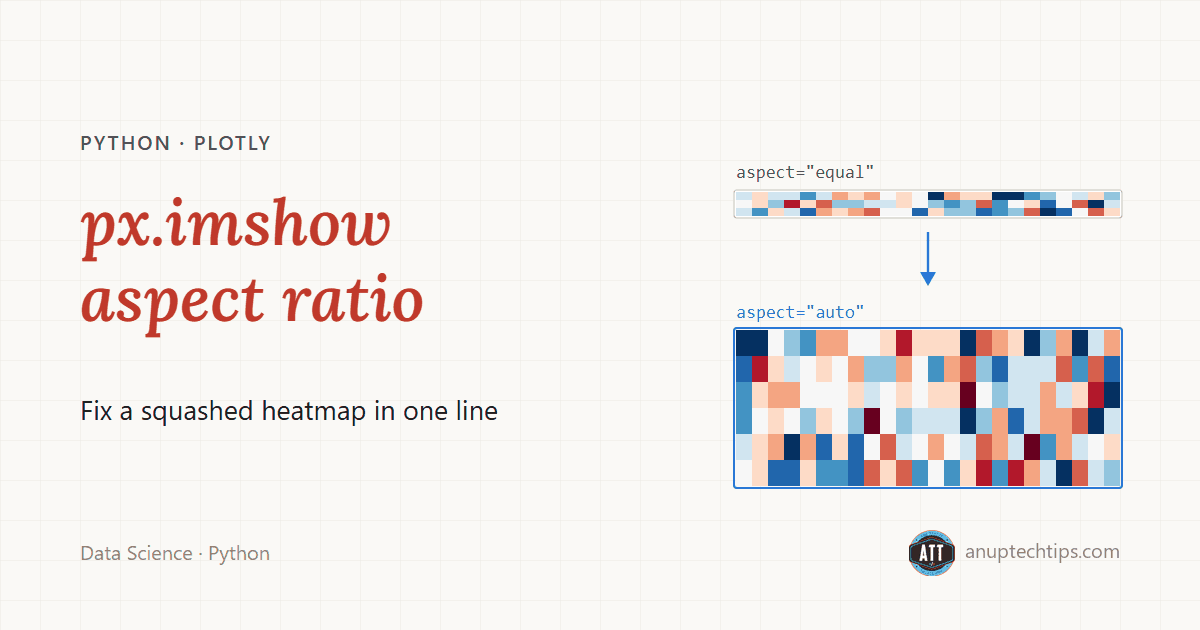

You pass a 6 × 48 matrix to px.imshow and get back a thin ribbon of colored squares floating in a mostly empty figure. Nothing is broken. That’s the default doing exactly what it was told.
The px.imshow aspect argument decides the shape of every cell: with aspect="equal", the default for NumPy arrays and DataFrames, cells stay square, so a wide matrix squashes into a strip; with aspect="auto", the cells stretch to fill the plot. For heatmaps, I’d make "auto" your habit and keep "equal" for images and maps, where a square really means something.
In this post I’ll take you through what the aspect ratio setting actually changes, how to size the figure, why box-zoom gets stuck, and when go.Heatmap is the better tool.
Updated 30 September 2026 · Tested with plotly 5.22, checked against the plotly 7.1 docs
The short answer
- Heatmap squashed into a thin strip? Pass
aspect="auto".- Want a bigger or smaller figure? Use
width=andheight=. The aspect only decides the cell shape inside it.- Box-zoom won’t select a thin slice? That’s
aspect="equal"linking the two axes.aspect="auto"frees them.
What does aspect do in px.imshow?
It decides whether one unit on the x-axis is as wide as one unit on the y-axis. "equal" links the axes, so every cell is square and the heatmap keeps your array’s shape. "auto" drops the link, keeps the plotting area fixed and stretches the cells to fit it.
| Value | Cell shape | What plotly sets | Use it for |
|---|---|---|---|
"equal" | Square | scaleanchor="y" and constrain="domain" on the x-axis | Images, maps, grids where x and y share units |
"auto" | Stretched to fill the plot | No link between the axes | Heatmaps, correlation matrices, time × feature grids |
None (the default) | "equal" for NumPy arrays, lists and DataFrames; "auto" for xarray | Depends on the input | Leaving it to plotly |
You can see the link yourself. Let’s test it:
import numpy as np
import plotly.express as px

rng = np.random.default_rng(7)
data = rng.normal(size=(6, 48))   # 6 rows, 48 columns

fig = px.imshow(data)
print(fig.layout.xaxis.scaleanchor, fig.layout.xaxis.constrain)
# Output: y domain

fig = px.imshow(data, aspect="auto")
print(fig.layout.xaxis.scaleanchor, fig.layout.xaxis.constrain)
# Output: None None
One gotcha that’s easy to miss: aspect takes no numbers. px.imshow(data, aspect=1.5) doesn’t raise an error. It quietly behaves like "auto", because plotly only checks for "equal". If you want a specific ratio, set it on the axes instead:
fig = px.imshow(data[:, :12], color_continuous_scale="RdBu_r")
fig.update_xaxes(scaleanchor="y", scaleratio=2)   # each cell twice as wide as it is tall
fig.show()
Why is my px.imshow heatmap a thin strip?
Because the default keeps the cells square and the figure has a fixed width. Forty-eight columns share that width, so each cell is small, and six rows of small squares make a short strip. aspect="auto" lets the rows grow into the empty space.
Here’s the same matrix, drawn both ways:
import numpy as np
import plotly.express as px

rng = np.random.default_rng(7)
data = rng.normal(size=(6, 48))   # 6 rows, 48 columns

# Default: aspect="equal", square cells
fig = px.imshow(data, color_continuous_scale="RdBu_r")
fig.show()

# Stretch the cells to fill the plot
fig = px.imshow(data, aspect="auto", color_continuous_scale="RdBu_r")
fig.show()
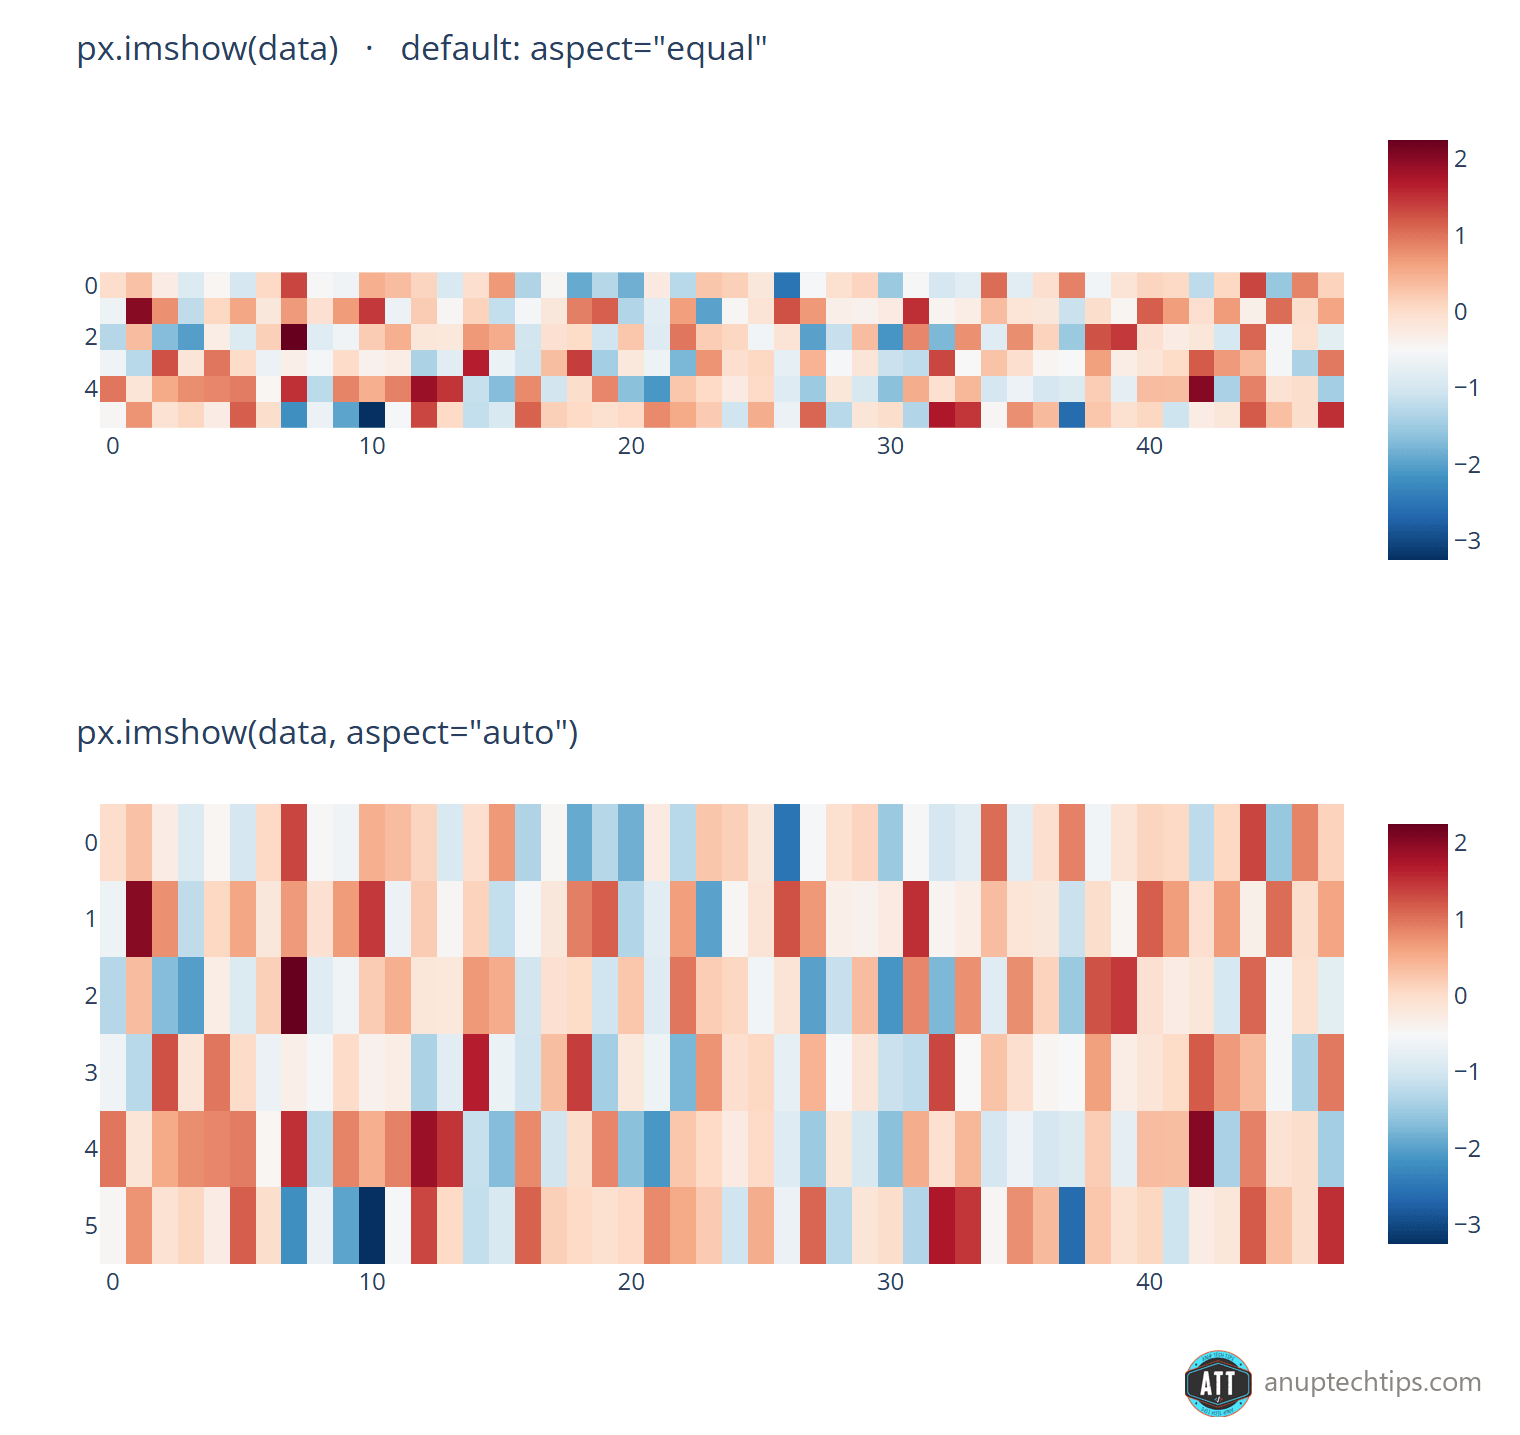
aspect="equal". Bottom: aspect="auto". Same data, same figure size.With the default, the six rows came out about 65 pixels tall in a 330-pixel figure, and most of the figure is white. With "auto", each cell is taller than it is wide, which is fine for a heatmap. The color carries the information, not the cell shape.
How do you change the size of a px.imshow heatmap?
Set width and height, in pixels, right in the call or later with fig.update_layout(). That sizes the figure. The aspect then decides how the cells use that space, and the two work together: "auto" fills whatever size you give it.
fig = px.imshow(data, aspect="auto", width=900, height=300)
fig.show()

# the same thing, after the fact
fig.update_layout(width=900, height=300)
Here’s the trap. With aspect="equal", a taller figure doesn’t help a wide matrix at all. The width decides the cell size, so the strip stays the same height and you just get more white space. Making the figure 600 pixels tall instead of 330 didn’t change the strip by a single pixel.
Got several matrices to compare? Pass a 3D array with facet_col, and each one gets its own panel. animation_frame does the same as a slider:
cube = rng.normal(size=(4, 6, 48))   # four 6 x 48 matrices

fig = px.imshow(cube, facet_col=0, facet_col_wrap=2, aspect="auto")
fig.show()
Why can’t I box-zoom into a px.imshow heatmap?
Because aspect="equal" ties the x-axis to the y-axis, so any zoom has to keep the cells square. Drag a thin box and plotly widens it to keep the ratio, which makes selecting one row or a narrow slice impossible. aspect="auto" removes the link, and box-zoom works in any direction.
It’s a common surprise, reported in plotly.py issue #3636. The scaleanchor="y" you saw in the first code block is the whole story: zoom one axis, and the anchored one follows.
Does aspect work for RGB images?
No. For a color image, an array shaped (height, width, 3) or with 4 channels, px.imshow draws an Image trace instead of a Heatmap, and the browser keeps the pixels square whatever aspect says (issue #5172).
To let the image stretch, turn the axis link off, as a plotly maintainer suggests in issue #4861:
rgb_image = rng.integers(0, 255, size=(40, 120, 3), dtype=np.uint8)   # stand-in for your photo

fig = px.imshow(rgb_image)
# False, not None: None means "use the default", which keeps the link
fig.update_layout(xaxis_scaleanchor=False, yaxis_scaleanchor=False)
fig.show()
In a 760 × 420 figure, a 40 × 120 random image stayed about 227 pixels tall with aspect="auto", and stretched to about 320 once the axes were unlinked.
px.imshow vs go.Heatmap: which one should you use?
Use px.imshow for a quick look at an array or a DataFrame. Reach for go.Heatmap when you need uneven x or y coordinates, want to combine traces, or need full control. The difference that bites most people is where row 0 ends up.
| px.imshow | go.Heatmap | |
|---|---|---|
| Input | 2D array, DataFrame, xarray, or an RGB image | z as a 2D array, with x and y passed separately |
| Cell shape by default | Square ("equal") for arrays and DataFrames | Fills the plot, like "auto" |
| Row 0 | At the top (the y-axis is reversed) | At the bottom |
| RGB images | Yes, as an Image trace | No |
| Several matrices | facet_col, animation_frame | Build the subplots yourself |
| Values in cells | text_auto | texttemplate |
If you move from px.imshow to go.Heatmap and your matrix suddenly looks upside down, that’s why. Flip the axis back:
import plotly.graph_objects as go

fig = go.Figure(go.Heatmap(z=data, colorscale="RdBu_r"))
fig.update_yaxes(autorange="reversed")   # row 0 at the top, like px.imshow
fig.show()
The px.imshow options most heatmaps need
Most real heatmaps are a correlation matrix or something like it, and they need four or five more arguments than the defaults:
import numpy as np
import pandas as pd
import plotly.express as px

rng = np.random.default_rng(7)
df = pd.DataFrame(rng.normal(size=(200, 5)),
                  columns=["price", "rooms", "area", "age", "distance"])
corr = df.corr()

fig = px.imshow(
    corr,
    text_auto=".2f",                   # print each value in its cell
    aspect="auto",
    color_continuous_scale="RdBu_r",   # blue for negative, red for positive
    zmin=-1, zmax=1,                   # fix the color range for correlations
    labels=dict(x="Feature", y="Feature", color="Correlation"),
)
fig.show()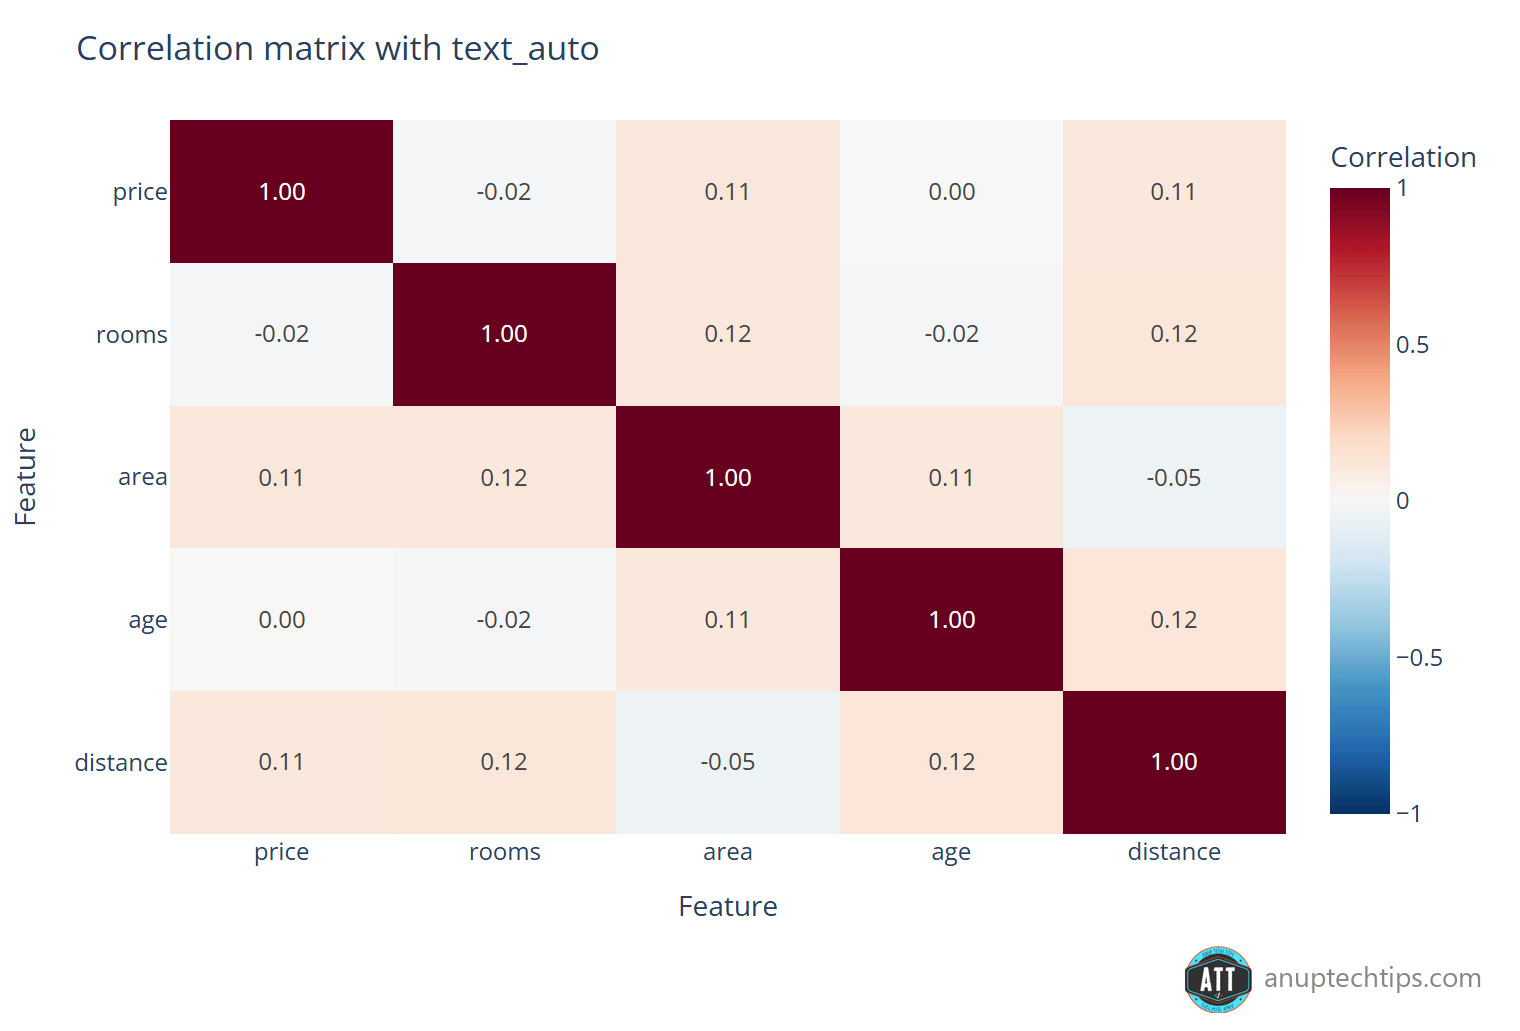
text_auto=".2f" prints the values; zmin and zmax keep 0 in the middle of the color scale.text_auto:True, or a d3 format string such as".2f", writes the values in the cells (single-channel data only).color_continuous_scale: any named plotly color scale, such as"Viridis"or"RdBu_r", or a list of colors.zminandzmax: fix the ends of the color scale. Without them the range follows your data, and a correlation of 0.12 can look dark red.labels: titles for the x-axis, the y-axis and the color bar (keysx,yandcolor), also used in the hover text.xandy: tick labels for the columns and rows. Their lengths must match the array.origin:"upper"(the default, row 0 at the top) or"lower".
For more chart types in Matplotlib, Seaborn and Plotly, see my Python data visualization guide, and if you like small wins like this one, the Python tips for cleaner code post is full of them.
FAQ
What is the default aspect in px.imshow?
None, which means "equal" (square cells) for NumPy arrays, lists and pandas DataFrames, and "auto" for xarray data.
How do I change the aspect ratio of a Plotly heatmap?
Pass aspect="auto" to fill the plot. For a specific ratio, link the axes and set it: fig.update_xaxes(scaleanchor="y", scaleratio=2) makes each cell twice as wide as it is tall.
How do I make a px.imshow heatmap bigger?
Set width and height in pixels. With the default "equal", a wide matrix is limited by the width, so add aspect="auto" or a taller figure won’t help.
Why can’t I zoom into part of my px.imshow heatmap?
With aspect="equal", the x-axis is anchored to the y-axis, so the zoom box keeps its shape. Use aspect="auto" to zoom freely.
Does aspect="auto" work for RGB images?
No. Color images use an Image trace, which keeps pixels square. Unlink the axes with fig.update_layout(xaxis_scaleanchor=False, yaxis_scaleanchor=False) instead.
Can I pass a number, like aspect=2?
It won’t raise an error, but it behaves like "auto". Use scaleanchor with scaleratio for an exact ratio.
So that’s my rule now: heatmap, aspect="auto"; image, leave it alone. It’s one argument, and it’s the difference between a chart people read and a colored ribbon they scroll past.
Over to you: have you been caught by the upside-down row 0 when switching to go.Heatmap, or was it the zoom that got you? Tell me in the comments. Be curious, and keep learning.